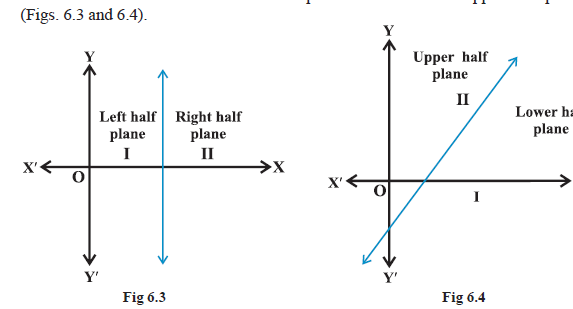
`\color{red} ✍️` Let us consider the line `color(purple)(ax + by = c, \ \ a ≠ 0, b ≠ 0) .................................. (1)`
`color(red)("There are three possibilities namely :")`
`(i) color(blue)(ax + by = c) \ \ \ \ (ii) color(blue)(ax + by > c) \ \ \ \ \ (iii) color(blue)(ax + by < c.)`
`\color{red} ✍️` In case `(i),` clearly, all points `(x, y)` satisfying `(i)` lie on the line it represents and conversely.
`\color{red} ✍️` Consider case (ii), `color(red)("let us first assume that" \ \ b > 0.)`
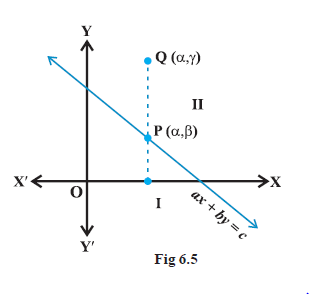
Consider a point `color(blue)(P (α,β))` on the line `ax + by = c, b > 0,` so that `aα + bβ = c.` Take an arbitrary point `Q (α , γ)` in the half plane `II` (Fig 6.5).
● we interpret, `γ > β`
or `b γ > bβ` or `aα + b γ > aα + bβ` or `aα + b γ > c` i.e., `Q(α, γ )` satisfies the inequality `ax + by > c`
● Thus, all the points lying in the half plane `II` above the line ax + by = c satisfies the inequality `ax + by > c.` Conversely, let `(α, β)` be a point on line `ax + by = c` and an arbitrary point `Q(α, γ)` satisfying
`ax + by > c`
so that `aα + bγ > c`
`⇒ aα + b γ > aα + bβ`
`color(blue)(⇒ γ > β (as b > 0))`
`color(blue)("This means that the point (α, γ ) lies in the half plane II.")`
`\color{green} ★ \color{green} \mathbf(KEY \ POINTS)`
`"1"` The region containing all the solutions of an inequality is called `color(blue)("the solution region.")`
`2.` In order to identify the half plane represented by an inequality, it is just sufficient to take any point `(a, b)` (not online) and check whether it satisfies the inequality or not.
If it satisfies, then the inequality represents the half plane and shade the region which contains the point, otherwise, the inequality represents that half plane which does not contain the point within it. For convenience, the point `(0, 0)` is preferred.
`3.` If an inequality is of the type `color(blue)(ax + by ≥ c)` or `color(blue)(ax + by ≤ c,)` then the points on the line `color(blue)(ax + by = c)` are also included in the solution region. So draw a dark line in the solution region.
`4.` If an inequality is of the form `ax + by > c` or `ax + by < c,` then the points on the line `ax + by = c` are not to be included in the solution region. So draw a broken or dotted line in the solution region.
`\color{red} ✍️` Let us consider the line `color(purple)(ax + by = c, \ \ a ≠ 0, b ≠ 0) .................................. (1)`
`color(red)("There are three possibilities namely :")`
`(i) color(blue)(ax + by = c) \ \ \ \ (ii) color(blue)(ax + by > c) \ \ \ \ \ (iii) color(blue)(ax + by < c.)`
`\color{red} ✍️` In case `(i),` clearly, all points `(x, y)` satisfying `(i)` lie on the line it represents and conversely.
`\color{red} ✍️` Consider case (ii), `color(red)("let us first assume that" \ \ b > 0.)`
Consider a point `color(blue)(P (α,β))` on the line `ax + by = c, b > 0,` so that `aα + bβ = c.` Take an arbitrary point `Q (α , γ)` in the half plane `II` (Fig 6.5).
● we interpret, `γ > β`
or `b γ > bβ` or `aα + b γ > aα + bβ` or `aα + b γ > c` i.e., `Q(α, γ )` satisfies the inequality `ax + by > c`
● Thus, all the points lying in the half plane `II` above the line ax + by = c satisfies the inequality `ax + by > c.` Conversely, let `(α, β)` be a point on line `ax + by = c` and an arbitrary point `Q(α, γ)` satisfying
`ax + by > c`
so that `aα + bγ > c`
`⇒ aα + b γ > aα + bβ`
`color(blue)(⇒ γ > β (as b > 0))`
`color(blue)("This means that the point (α, γ ) lies in the half plane II.")`
`\color{green} ★ \color{green} \mathbf(KEY \ POINTS)`
`"1"` The region containing all the solutions of an inequality is called `color(blue)("the solution region.")`
`2.` In order to identify the half plane represented by an inequality, it is just sufficient to take any point `(a, b)` (not online) and check whether it satisfies the inequality or not.
If it satisfies, then the inequality represents the half plane and shade the region which contains the point, otherwise, the inequality represents that half plane which does not contain the point within it. For convenience, the point `(0, 0)` is preferred.
`3.` If an inequality is of the type `color(blue)(ax + by ≥ c)` or `color(blue)(ax + by ≤ c,)` then the points on the line `color(blue)(ax + by = c)` are also included in the solution region. So draw a dark line in the solution region.
`4.` If an inequality is of the form `ax + by > c` or `ax + by < c,` then the points on the line `ax + by = c` are not to be included in the solution region. So draw a broken or dotted line in the solution region.